Navigating the intricate world of machine learning is no small feat, and measuring model performance is undoubtedly one of the most crucial aspects. As we embark on this journey together through the realm of data science, we find ourselves frequently pondering over questions like: How good is our model? Is it performing well, and if not, how can we improve it? And most importantly, how can we quantify its performance?
The answers to these questions lie in the careful use of performance metrics that help us evaluate the success of our predictive models. In this blog post, we aim to delve into some of these essential tools: ROC AUC, recall, precision, F1 score, confusion matrices, and finding problematic input images.
Receiver Operating Characteristic Area Under the Curve (ROC AUC) is a widely used metric for evaluating the trade-off between true positive rate and false positive rate across different thresholds. It helps us understand the overall performance of our model under varying circumstances.
Precision and recall are two incredibly informative metrics for problems where the data is unbalanced. Precision allows us to understand how many of the positive identifications were actually correct, while recall helps us to know how many actual positives were identified correctly.
Confusion matrices are a simple yet powerful visual representation of a model's performance. This tool helps us understand the true positives, true negatives, false positives, and false negatives, thereby providing an overview of a model's accuracy.
This post should serve as your guide to unravel the complexities of model performance and evaluation metrics, providing insights into how you can effectively measure and improve your machine learning models.


Concepts that perform well tend to be the ones that are annotated in images photographed in a consistent and unique way.
Concepts that tend to perform poorly are those:
Keep in mind the model has no concept of language; so, in essence, “what you see is what you get.”
Let’s take a case of a false positive prediction made by a model in the process of training to recognize wedding imagery.
Here is an example of an image of a married couple, which had a false positive prediction for a person holding a bouquet of flowers, even though there is no bouquet in the photo.
What’s going on here?

A photo’s composition and the combination of elements therein could confuse a model.
All the images below were labeled with the ‘Bouquet_Floral_Holding’ concept.
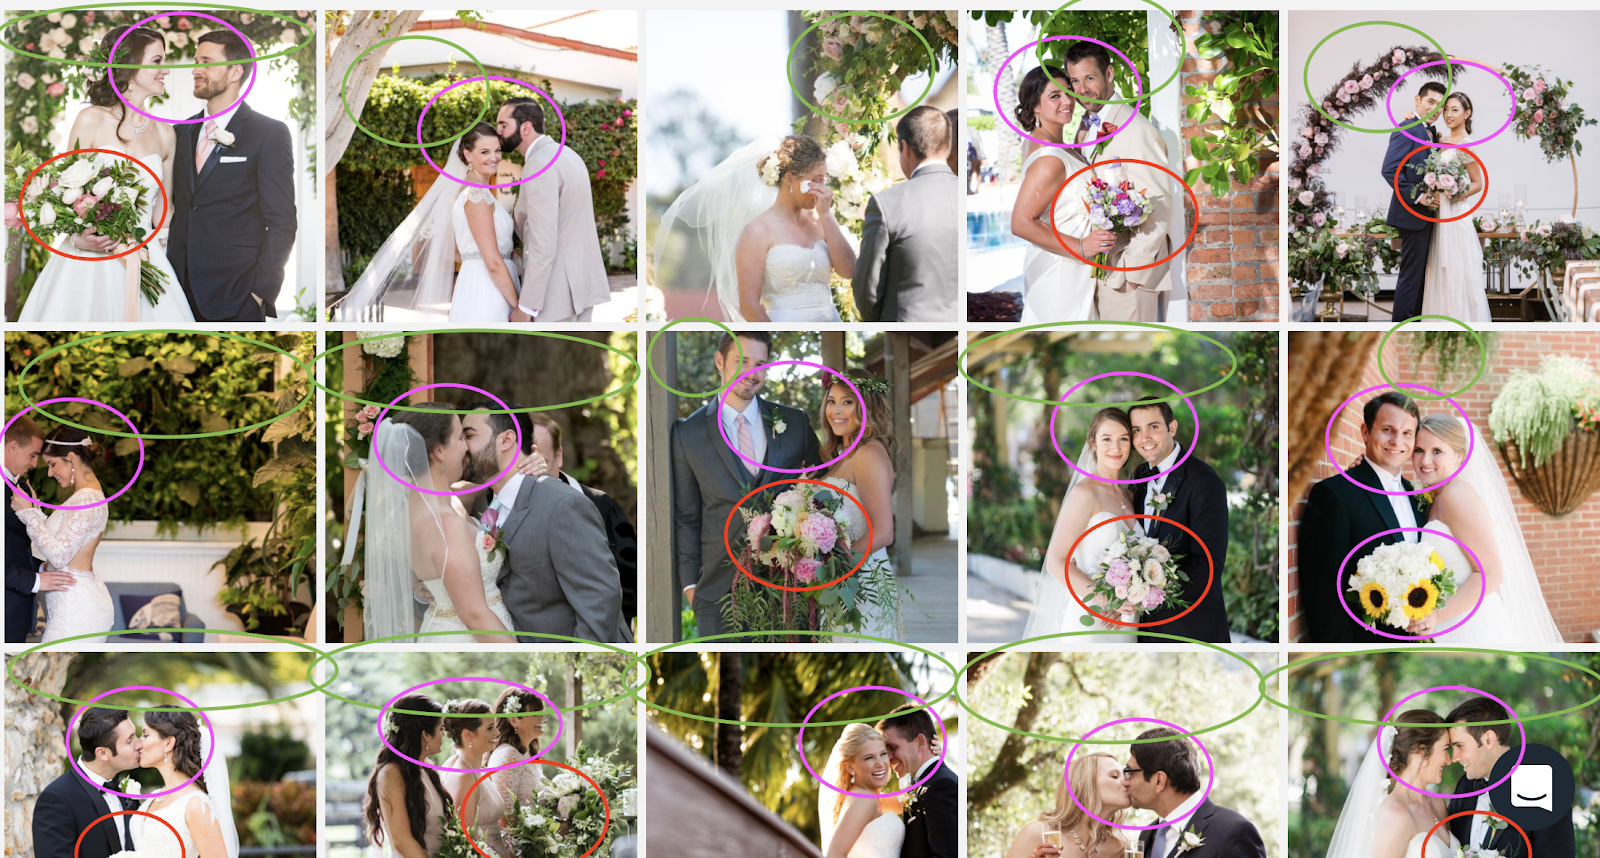
In this very rare instance, the image in question has:
The model sees the combination of all these individual things in lots of photos labeled ‘Bouquet_Floral_Holding’; and thus, that is the top result.


One way to fix this is to narrow the training data for ‘Bouquet_Floral_Holding’ to images in which the bouquet is the focal point, rather than any instance of the bouquet being held.
This way, the model can focus on the anchoring theme/object within the dataset more easily.
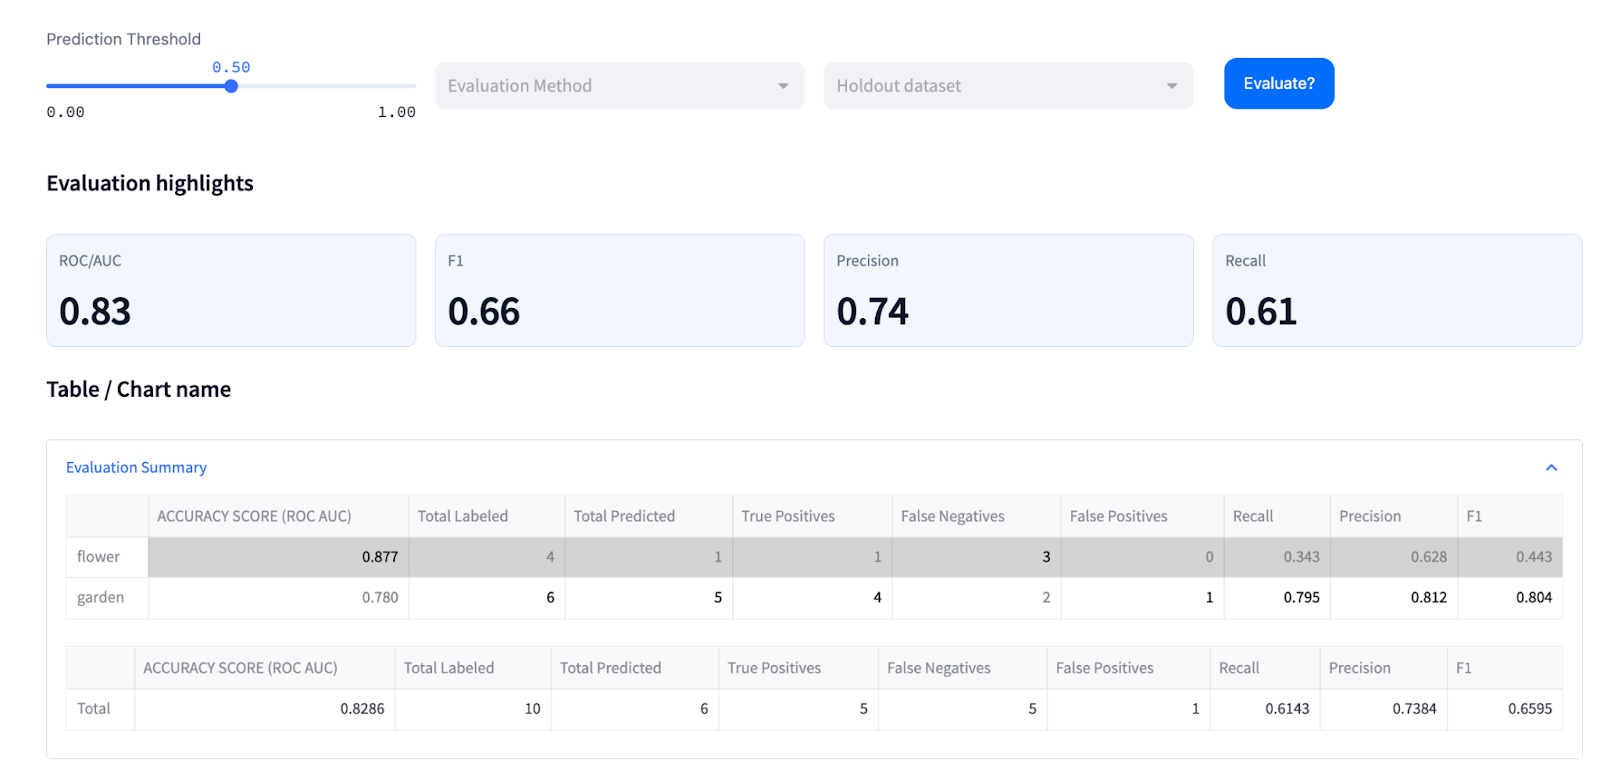
Above table is available in model evaluation page in the legacy Clarifai’s Explorer UI
The ROC AUC (Concept Accuracy Score) is the concept’s prediction performance score, defined by the area under the Receiver Operating Characteristic curve. This score gives us an idea of how well we have separated our different classes, or concepts.
ROC AUC is generated by plotting the True Positive Rate (y-axis) against the False Positive Rate (x-axis) as you vary the threshold for assigning observations to a given class. The AUC, or Area Under the Curve of these points, is (arguably) the best way to summarize a model’s performance in a single number.
You can think of AUC as representing the probability that a classifier will rank a randomly chosen positive observation higher than a randomly chosen negative observation, and thus it is a useful metric even for datasets with highly unbalanced classes.
A score of 1 represents a perfect model; a score of .5 represents a model that would be no better than random guessing, and this wouldn’t be suitable for predictions and should be re-trained.
Note that the ROC AUC is not dependent on the prediction threshold.
Above table is available in model evaluation page in the legacy Clarifai’s Explorer UI
A concept-by-concept matrix is a graphic flattening of data to show what has been labeled for a concept. This tool is another way of visualizing the performance of a model.
It allows us to review where we see true positives, or correctly predicted inputs (the diagonal row). Simply put, this is an excellent tool for telling us where our model gets things right or wrong.
Each row represents the subset of the test set that was actually labeled as a concept, e.g., “dog.” As you go across the row, each cell shows the number of times those images were predicted as each concept, noted by the column name.
The diagonal cells represent True Positives, i.e., correctly predicted inputs. You’d want this number to be as close to the Total Labeled as possible.
Depending on how your model was trained, the off-diagonal cells could include both correct and incorrect predictions. In a non-mutually exclusive concepts environment, you can label an image with more than 1 concept.
For example, an image labeled as both “hamburger” and “sandwich” would be counted in both the “hamburger” row and the “sandwich” row. If the model correctly predicts this image to be both “hamburger” and “sandwich,” then this input will be counted in both on and off-diagonal cells.

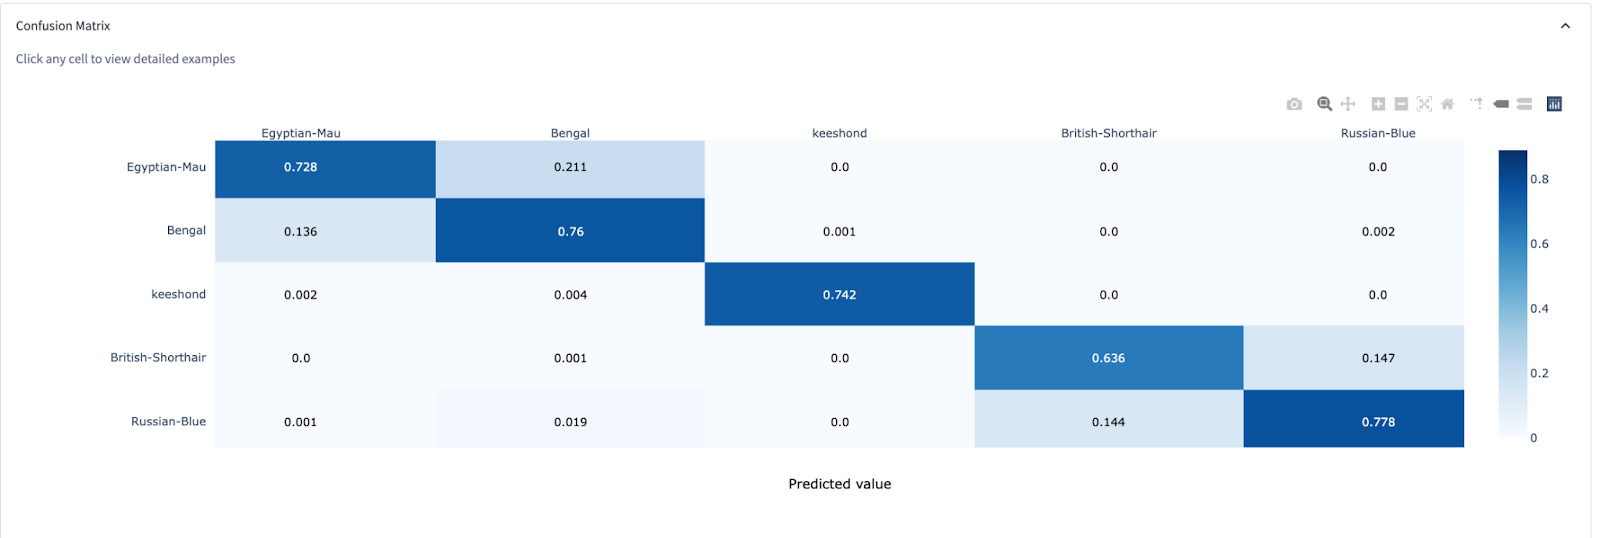
Above table is available in model evaluation page in the legacy Clarifai’s Explorer UI
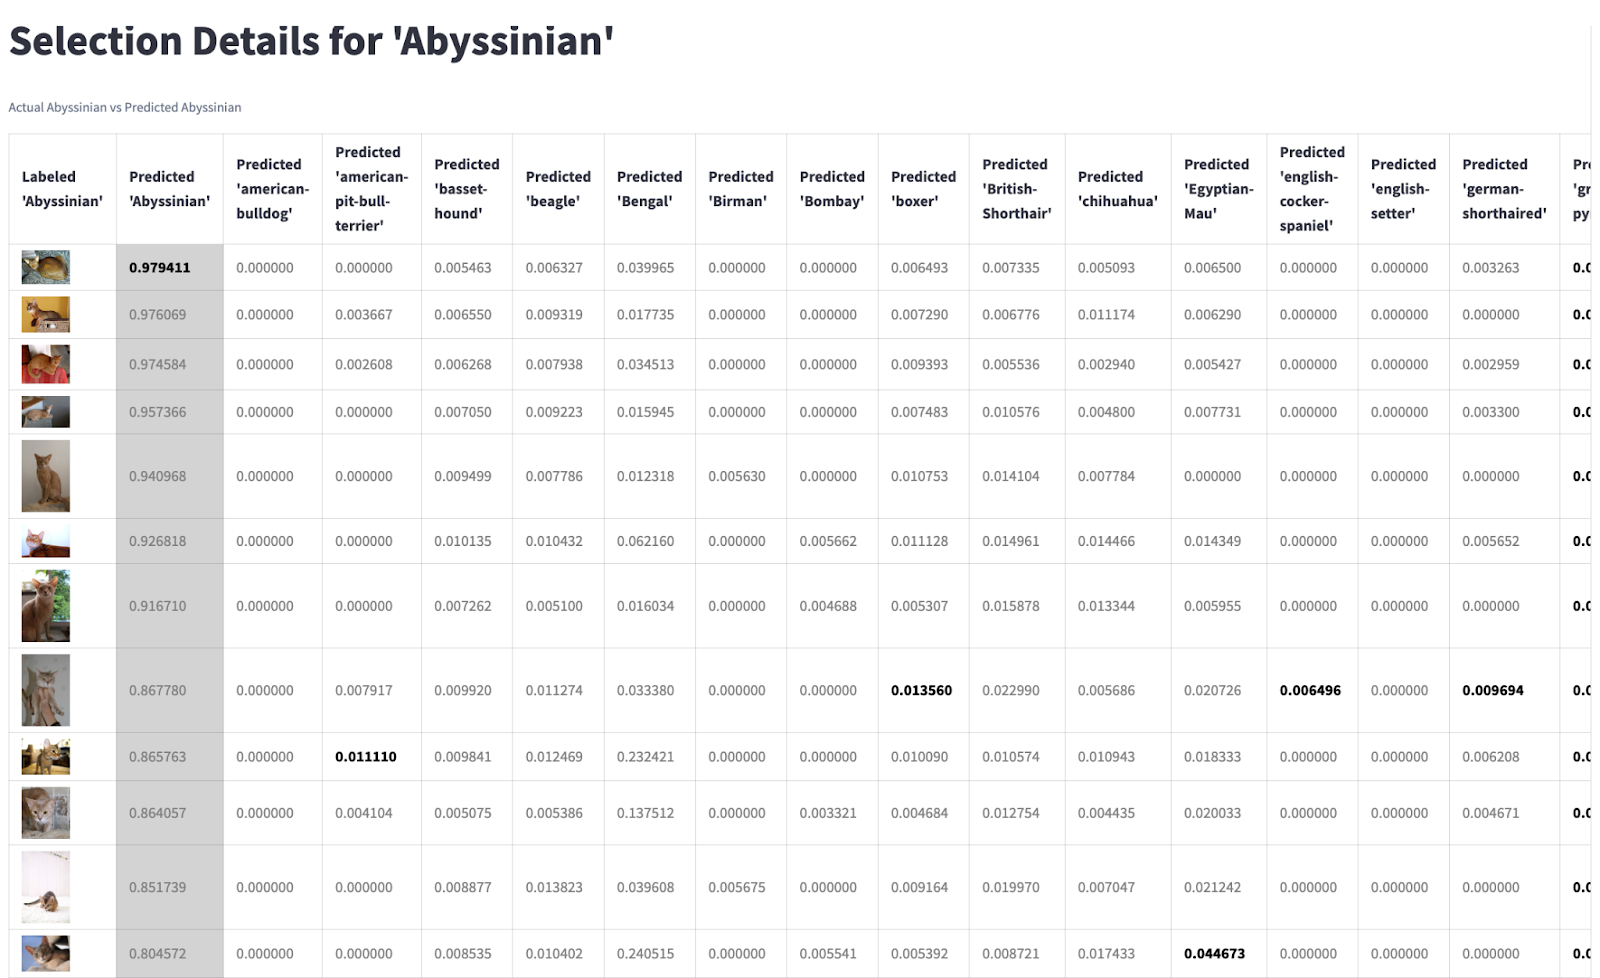
This is a sample confusion matrix for a model. The Y-axis Actual Concepts are plotted against the X-axis Predicted Concepts. The cells display average prediction probability for a certain concept, and for a group of images that were labeled as a certain concept.
The diagonal cells are the average probability for true positives, and any cells off the horizontal cells contain the average probability for non-true positives. From this confusion matrix, we can see that each concept is distinct from one another, with a few areas of overlap, or clustering.
Concepts that co-occur, or are similar, may appear as a cluster on the matrix.
Recall rate refers to the proportion of the images labeled as the concept that were predicted as the concept. It is calculated as True Positives divided by Total Labeled. Also known as “sensitivity” or “true positive rate.”
Precision rate refers to the proportion of the images predicted as a concept that had been actually labeled as the concept. It is calculated as True Positives divided by Total Predicted. Also known as “positive predictive value.”
You can think of precision and recall in the context of what we want to calibrate our model towards. Precision and recall are inversely correlated; so, ultimately the ratio of false positives to false negatives is up to the client according to their goal.

We’re asking one of the following of our model:
Or,
Example:
Precision = tp÷(tp+fp)
I guess for X, and my guess is correct, although I may miss another X.
Or,
Recall = tp ÷ (tp+fn)
I guess all the X as X, but occasionally predict other subjects that are not X as X.
A threshold is the “sweet spot” numerical score that is dependent on the objective of your prediction for recall and/or precision. In practice, there are multiple ways to define “accuracy” when it comes to machine learning, and the threshold is the number we use to gauge our preferences.
You might be wondering how you should set your classification threshold, once you are ready to use it to predict out-of-sample data. This is more of a business decision, in that you have to decide whether you would rather minimize your false positive rate or maximize your true positive rate.
If our model is used to predict concepts that lead to a high-stakes decision, like a diagnosis of a disease or moderation for safety, we might consider a few false positives as forgivable (better to be safe than sorry!). In this case, we might want high precision.
If our model is used to predict concepts that lead to a suggestion or flexible outcome, we might want high recall so that the model can allow for exploration.
In either scenario, we will want to ensure our model is trained and tested with data that best reflects its use case.
Once we have determined the goal of our model (high precision or high recall), we can use test data that our model has never seen before to evaluate how well our model predicts according to the standards we have set.
The goal of any model is to get it to see the world as you see it.
In multi-class classification, accuracy is determined by the number of correct predictions divided by the total number of examples.
In binary classification, or for mutually exclusive classes, accuracy is determined by the number of true positives added to the number of true negatives, divided by the total number of examples.
Once we have established the goal we are working towards with the ground truth, we begin to assess your model’s prediction returns. This is a completely subjective question, and most clients simply want to know that their models will perform to their standards once it is in the real world.
We begin by running a test set of images through the model and reading their precision and recall scores. The test set of images should be:
Once we have our precision or recall scores, we will compare these to the model’s recall or precision thresholds for .5 and .8, respectively.
© 2023 Clarifai, Inc. Terms of Service Content TakedownPrivacy Policy


© 2023 Clarifai, Inc. Terms of Service Content TakedownPrivacy Policy